TradersLab @TradersLab_
Cutting-edge platform designed to help traders streamline their decision-making process with a top-down market analysis to uncover high-potential opportunities. TradersLab.io https://discord.gg/75xgVFtGcp Joined August 2024-
Tweets712
-
Followers4K
-
Following82
-
Likes709

Steel is now #1 on @TradersLab_ top ten themes. This is tied to AI infrastructure and physical robotic builds. Another way of playing the old picks and shovels play. They are literally using picks and shovels to get the iron ore…


@PrimeTrading_ As a @TradersLab_ subscriber myself, I love this new feature. Easy to see what groups are leading and even the leading themes within the leading groups. Super cool
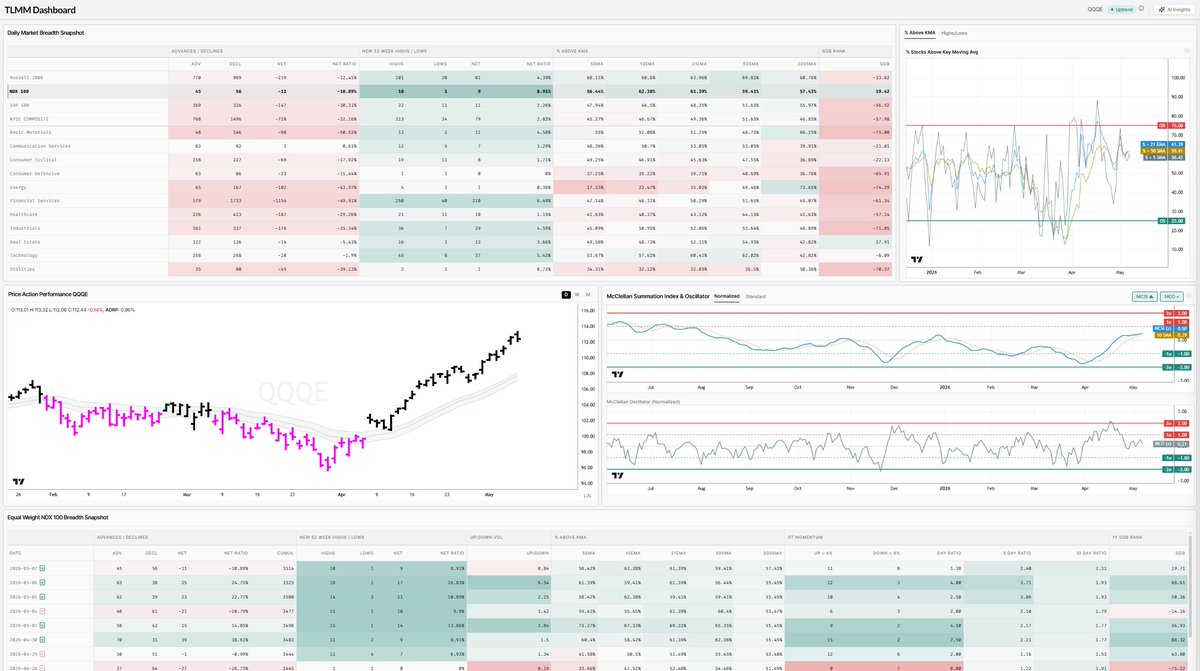
📊 TLMM Dashboard — Uptrend Tape is constructive: $QQQE trending cleanly above the 21dma-structure area with breadth internals turning back up after a healthy reset. 📈 Price Action ($QQQE) Trading 112.44, well above the 21dma-structure area Clean stair-step trend off the April lows — consecutive higher highs, no distribution character Mild -0.14% daily pullback, ADRP 0.96% (orderly) 🌡️ Breadth Internals (MCSI / MCO) MCSI z-score 0.50, above a rising 10dma (0.39) → constructive backdrop intact MCO z-score 0.21 — neutral, neither oversold nor overbought Translation: trend is on, no exhaustion signal, no dip signal yet — carry positions, no chase 👀 Breadth Snapshot $NDX 100 leading: 61.4% above 21EMA, 59.4% above 50SMA, GDB rank +19.4 New highs/lows: NDX 10/1, Russell 101/20 — broad participation under the surface Sector standouts: Technology (60% > 21EMA), Real Estate GDB +27.9 Laggards: Energy (-74 GDB), Utilities (-70), Industrials (-71) — defensives + cyclicals soft, classic risk-on rotation Takeaway Regime: Uptrend, risk-on. Lean long, respect the 21dma-structure area on $QQQE as the line. MCO neutral means next oversold dip is the buy — not chasing strength here. Watch: MCO push above +1σ = caution flag. Loss of 21dma-structure area + MCSI rolling under 10dma = regime change. By: @TradersLab_
We just released a new Market Internals page on TradersLab. 👀🔥 It brings key cross-asset data, credit spreads, volatility, rotation, rates, commodities, and crypto into one clean view with mini-charts. You can fully customize it to track what matters to your process, and use it to quickly read the broader environment behind price. There’s also a small layer starting to build on top to help interpret these signals… more on that soon. Hope you'll enjoy that new addition... and stay tuned for more releases soon!! 🙂 Tlab team ✌️

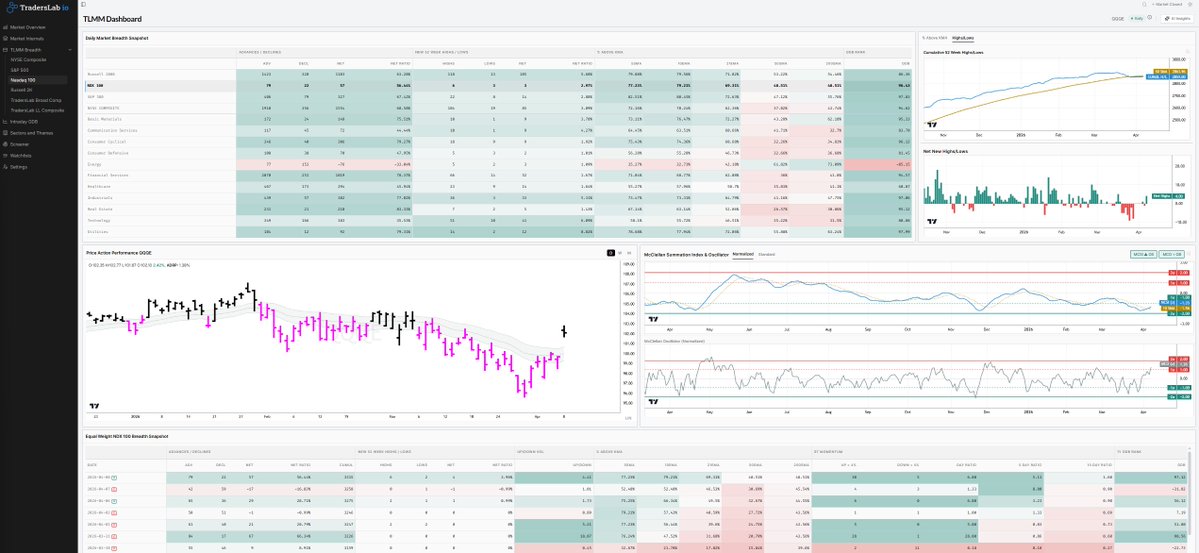
360° MARKET VIEW $QQQ TLMM Dashboard The NASDAQ is caught between short-term bounce mechanics and intermediate-term deterioration. Price structure is split: the 21-EMA is rising and price is above it, but the 50-SMA is flat-to-declining and price has broken below it. This is a classic setup for a rally that lacks structural confirmation. The McClellan Summation Index recovery is a positive signal for breadth stabilization, but it must be watched closely—if MCSI rolls over below its 10-day moving average again, it would confirm that the distribution phase is resuming. Participation at 44.5% above the 50-SMA is the key constraint; healthy rallies typically see this metric move toward 55%+. The dominance of new lows over new highs and the persistent negative Global Daily Breadth (-63.5) suggest that leadership is not expanding into the rally, which is a red flag for sustainability. Watch for: (1) whether participation can expand above 50% above the 50-SMA, (2) whether the 50-SMA can stabilize and begin rising, and (3) whether new highs can begin to expand relative to new lows. Until these confirmations occur, this remains a countertrend rally vulnerable to reversal.

360° MARKET VIEW $QQQ TLMM Dashboard The rally is real but contextually fragile. Extreme breadth readings (GDB +97, MCO Z +1.08) typically mark inflection points rather than continuation signals, especially within a downtrend. The reclamation of the MCSI 10-day moving average is a positive technical development, but it must be sustained and followed by actual participation expansion (% above 50-SMA moving above 60%) to signal a structural shift. Watch for: (1) whether MCSI continues higher and breaks above zero, (2) whether participation quality improves materially in the next 5-10 days, and (3) whether the 50-day SMA begins to flatten or rise. The current setup favors a pause or pullback in the near term given the extreme short-term extension. Leadership expansion remains the key missing piece—new highs are not broadening, which limits the conviction of this rally.
The correction is confirmed by broken price structure and deteriorating breadth. The 5-day breadth thrust (+86 GDB) is notable but must be contextualized: it represents a recovery from extreme weakness, not a trend reversal. For a meaningful uptrend to resume, NASDAQ would need to (1) reclaim the 50-SMA around 102.03, (2) see the McClellan Summation Index reclaim its 10-day moving average, and (3) expand participation back above 40% of stocks above the 50-SMA. Currently, only 27.7% qualify, which is well below healthy levels. Leadership expansion is stalled (cumulative net highs-lows at 2868 vs 50-day average of 2874.8), confirming that new highs are not driving the market. The 21-day deterioration in all major breadth metrics (participation down 23.8%, ad-net down 48, GDB down 79 points) establishes the corrective trend as the primary regime. Watch for stabilization at the 50-SMA as a potential inflection point, but confirmation would require breadth expansion, not just price bounce.

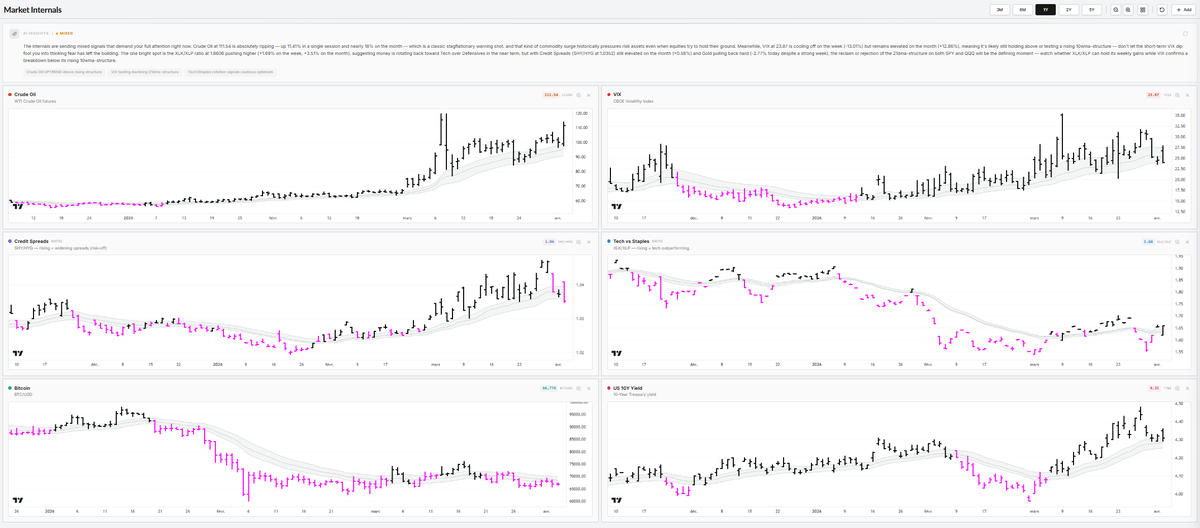
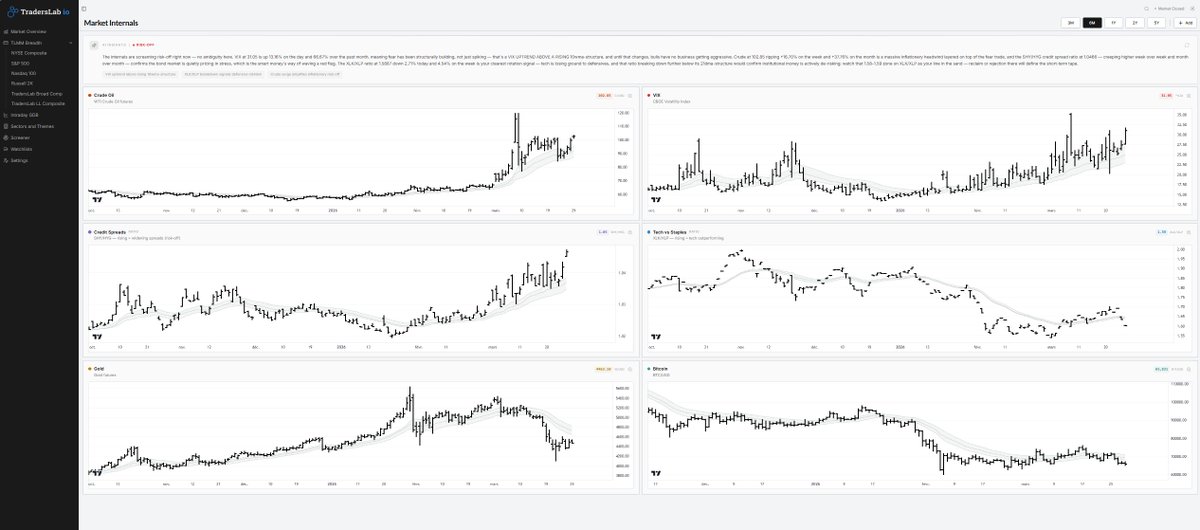
Market Internals - MIXED The internals are sending mixed signals that demand your full attention right now. Crude Oil at 111.54 is absolutely ripping — up 11.41% in a single session and nearly 18% on the month — which is a classic stagflationary warning shot, and that kind of commodity surge historically pressures risk assets even when equities try to hold their ground. Meanwhile, VIX at 23.87 is cooling off on the week (-13.01%) but remains elevated on the month (+12.86%), meaning it's likely still holding above or testing a rising 10wma-structure — don't let the short-term VIX dip fool you into thinking fear has left the building. The one bright spot is the XLK/XLP ratio at 1.6606 pushing higher (+1.69% on the week, +3.51% on the month), suggesting money is rotating back toward Tech over Defensives in the near term, but with Credit Spreads (SHY/HYG at 1.0352) still elevated on the month (+0.58%) and Gold pulling back hard (-2.77% today despite a strong week), the reclaim or rejection of the 21dma-structure on both SPY and QQQ will be the defining moment — watch whether XLK/XLP can hold its weekly gains while VIX confirms a breakdown below its rising 10wma-structure. • Crude Oil UPTREND above rising structure • VIX testing declining 21dma-structure • Tech/Staples rotation signals cautious optimism
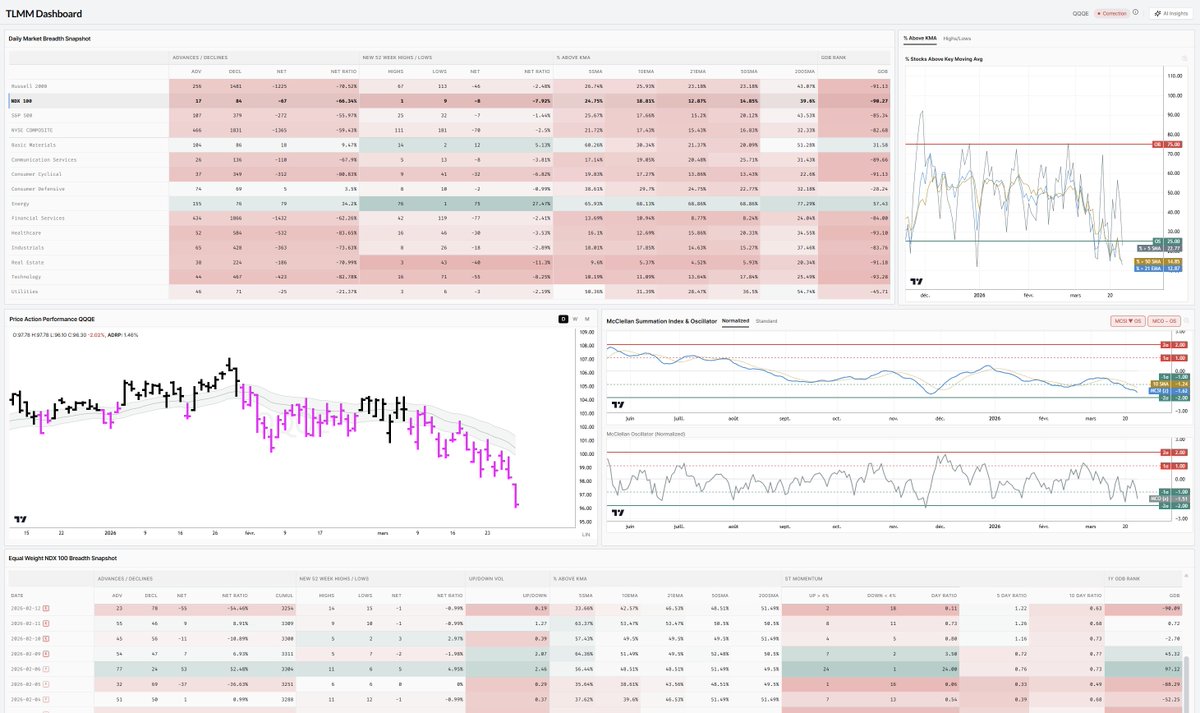
360° MARKET VIEW $QQQ TLMM Dashboard The correction is confirmed by price structure failure and breadth deterioration. Key observations: (1) Participation has fallen sharply—only 24.8% above 50-SMA is well into weak territory; (2) The 21-day GDB swing (+113 to -52) suggests a reflexive bounce may have exhausted; (3) Advancers are still leading on a net basis (+21 A/D net today), but this is masking internal weakness—volume is upside-dominant but participation is collapsing, a divergence typical of late-stage rallies; (4) The MCO Z-score of +0.30 is not extreme, suggesting room for further deterioration before an oversold bounce becomes likely; (5) Leadership is not expanding (cumulative net highs-lows below 50-DMA), which is a red flag in a correction. Watch for MCO to reach -2.0 Z-score or lower for potential oversold inflection. Confirmation of a bottom would require MCSI reclaiming its 10-DMA and price stabilizing above the 21-EMA.

Tech $XLK leading today. $XLP defensive lagging.

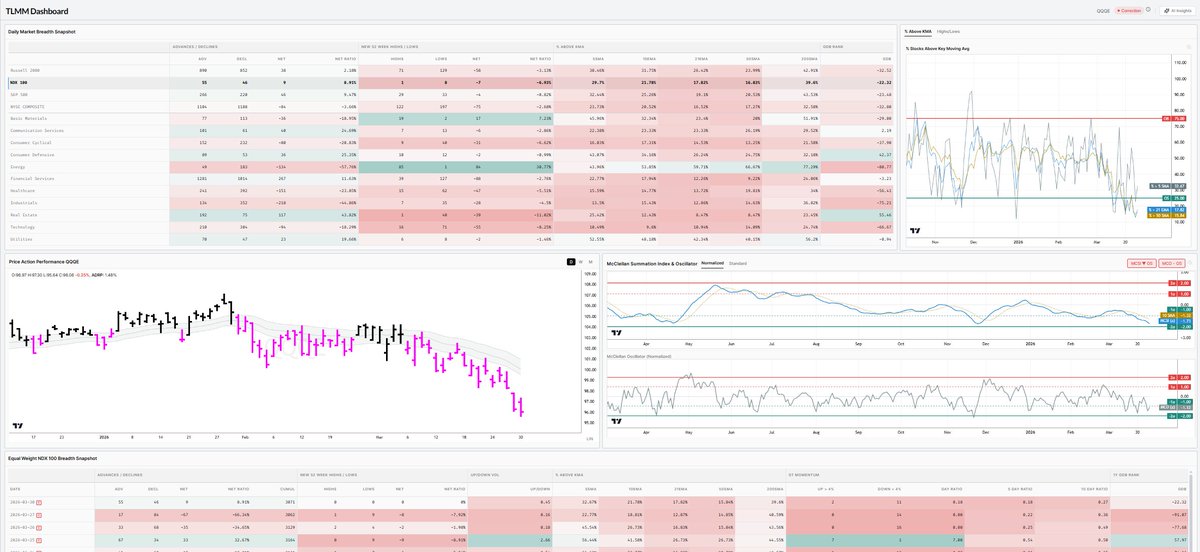
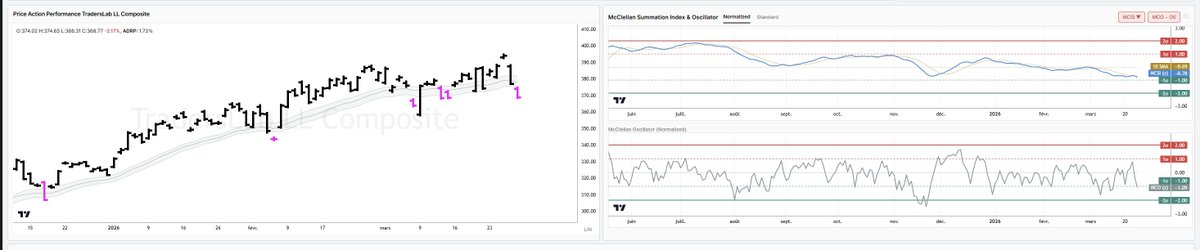
$QQQE running into declining 21dma-structure, while MCSI is following through on yesterday's hook-up. Interesting picture as indices are running into potential overhead supply.

The extreme Global Daily Breadth reading (+97) warrants scrutiny: it reflects concentrated upside in a narrow set of leaders rather than broad participation. With only 19.8% of stocks above the 50-SMA and leadership contracting, this breadth thrust is a distribution event masquerading as strength. The MCSI below its 10-day MA is the critical signal—it confirms that participation is not expanding despite the headline breadth number. Watch for MCSI reclaiming its 10-day MA (15.23) as a confirmation signal; failure to do so suggests the correction continues. Price must reclaim the 21-EMA (100.04) and ideally the 50-SMA (102.32) to signal structural recovery. The up/down volume ratio at 23:1 is extremely elevated and unsustainable, suggesting volume is concentrated in a few names. This is a tail-risk setup where the appearance of strength masks underlying weakness.

Biggest movers in LLs today 👇 Liquid Leaders Scan sorted by 1-Day Return. $APLD, $MRVL, $BE, $RKLB, $ASTS, $NBIS, $ONDS, $FSLY, $ON, $STM, $ARM, $TSEM, $MKSI, $SNDK, $ENTG, $ROKU, $W, $COHR, $CCL, $CLS By @TradersLab_

Impressive day for the liquid leaders, with +5.2% move, as the composite index tries to reclaim the 21dma-structure, and MCSI to hook up. The next few days should be interesting for this basket of stocks. $SNDK, $LITE, $SATS, $WDC, $ONDS, $FIVE, $CIEN, $PL, $TSEM, $STX, $FSLY, $BE, $VRT, $MTZ, $DOCN, $GEV, $TER, $NBIS, $MKSI, $ATI

360° MARKET VIEW $QQQ TLMM Dashboard Correction is well-established with no price structure support. The 21-day deterioration in participation (-35.6 percentage points in % above 50-SMA) is severe and suggests broad-based selling rather than sector rotation. Leadership is not expanding (cumulative net highs-lows at 2877 vs 50-day MA of 2880.72). Key watch: whether MCSI can reclaim its 10-day MA (17.92) to signal early breadth stabilization, or whether it continues lower. Price needs to reclaim 102.32 (50-SMA) to challenge correction thesis. Current flags include volume downside dominance, weak participation, and tail risk to the downside. The one-day bounce in MCO and GDB may represent a short-term oversold condition, but without participation expansion and price structure recovery, it lacks conviction.
Market Internal - RISK-OFF The internals are screaming risk-off right now — no ambiguity here. VIX at 31.05 is up 13.16% on the day and 66.67% over the past month, meaning fear has been structurally building, not just spiking — that's a VIX UPTREND ABOVE A RISING 10wma-structure, and until that changes, bulls have no business getting aggressive. Crude at 102.85 ripping +16.70% on the week and +37.76% on the month is a massive inflationary headwind layered on top of the fear trade, and the SHY/HYG credit spread ratio at 1.0466 — creeping higher week over week and month over month — confirms the bond market is quietly pricing in stress, which is the smart money's way of waving a red flag. The XLK/XLP ratio at 1.5887 down 2.71% today and 4.54% on the week is your clearest rotation signal — tech is losing ground to defensives, and that ratio breaking down further below its 21dma-structure would confirm institutional money is actively de-risking; watch that 1.58–1.59 zone on XLK/XLP as your line in the sand — reclaim or rejection there will define the short-term tape.
Our proprietary TLMM Trend Model has signaled a correction since Feb. 9th. Since then, the price/breadth/momentum is clear that this market is under-distributed.
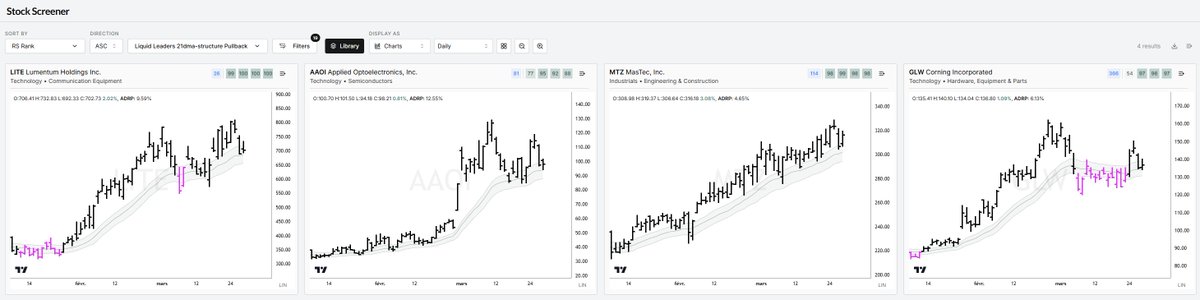
Photonics of the last group standing right at their rising 21dma-structure. Can they hold and resist the market pressure? That scan is getting thin, and it's normal considering the market environment. Liquid Leaders 21dma-structure Pullback sorted by RS Rank. $LITE, $AAOI, $MTZ, $GLW By @TradersLab_
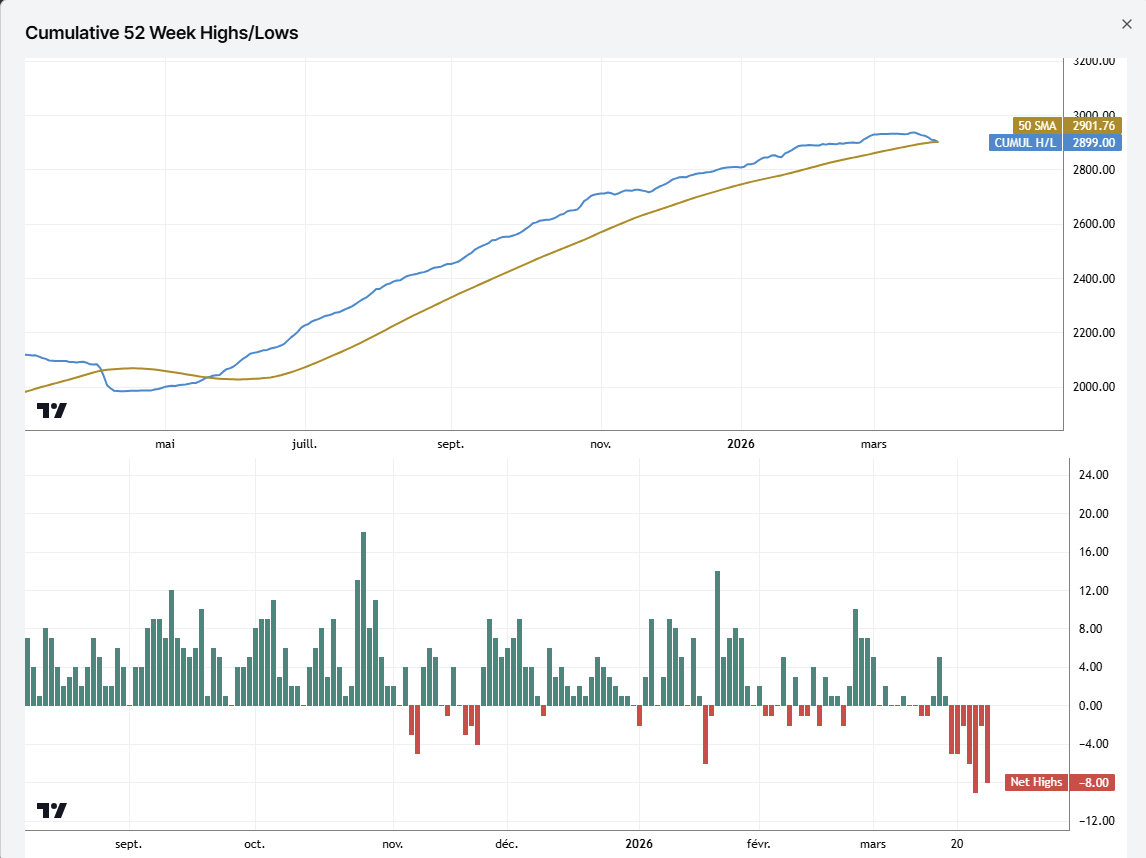
Net New Highs cumulative on $QQQ just about to cross below the 50dma. Last time it happened was April 3rd 2025.
Liquid Leaders broke their 21dma-structure & MCSI hooked down below the declining 10dma. Price & Breadth contraction as they came for the leaders as well in the last 2 days.

Liquid Leaders Scan sorted by RS Rank. $SNDK, $LITE, $PL, $WDC, $ONDS, $CIEN, $SATS, $TSEM, $FIVE, $FSLY, $VRT, $BE, $STX, $DOCN, $DELL, $GEV, $APLD, $MTZ, $MU, $TER By @TradersLab_


huu if @ifhuuu
0 Followers 28 Following
Mati 📈 • @MatiMaranesi
927 Followers 936 Following • Lic. en Administración - UNCuyo • Instagram @matimaranesi
MAG | @mash_557
55 Followers 332 Following
mehmet can @mehmetcan577574
78 Followers 954 Following
B @babcyajram
1 Followers 12 Following
boredkisjr @kisjr01
0 Followers 64 Following
jielee @singerjie
54 Followers 329 Following
chris guttilla @ChrisGuttilla
294 Followers 2K Following
b e tt y @BTC_Nono_Work
0 Followers 237 Following

Anna Nguyen @AnnaNguyen_SG
38 Followers 170 Following
Anson Lam @AnsonLam3
6 Followers 344 Following
A. T. @AT72116725
201 Followers 2K Following Assistant Professor at an engineering department by the day, Stock Market swing trader by the night
Sanjay Kumar @SanjayKuma72686
56 Followers 636 Following
Rafael Alegria @RafaelAlegria10
103 Followers 102 Following Dominican. MBA. Trader - Portfolio Manager
tyler @Thanaborde21781
13 Followers 57 Following
P. Caspar @ZenonZiembicki
0 Followers 657 Following
Sravan @sra1dreddy
369 Followers 2K Following
long live punjab @JotPabla
21 Followers 45 Following
Batman @Devendr06284288
1K Followers 2K Following All charts are for my own reference only, not recommending to other and don’t use it for your trade. I will not be responsible for your loss Not SEBI registered
Matias Scalbi @MatiasScalbi
6K Followers 640 Following Apasionado por las Finanzas | NOR VII | Papers Financieros | 10y exp | Bots de Trading | Market Maker Crypto | Top 0.6% Polymarket

Natthapat @Natthapat6996
0 Followers 6 Following
FUSQO @Fusqo4real
442 Followers 4K Following Tech. Investing, Oil & Gas, All Things Chelsea. Tweets ideas worth sharing.🇳🇬


Subhajit Laskar @LaskarSubh19821
2 Followers 220 Following
Don Arthur 🇨🇦 @golfingmedic
1K Followers 603 Following retired paramedic - trade stocks/etfs and options - I think outside the box in presenting my data/ideas
സുദീപ് @prodractil
546 Followers 1K Following
Steve @SteveBrehaut
333 Followers 2K Following Client-focused Marketing Technologist #CustomerSuccess #ABM #CX #BigData #AI #UX #MarketingAutomation #BusinessIntelligence #MachineLearning Incurably curious
Harvey Shen @hlshen
189 Followers 564 Following
SUPAPEL @SUPAPEL
16 Followers 567 Following
Nwa coal city @Nwacoalcity042
155 Followers 829 Following

AZee @AhmedZahee40789
165 Followers 854 Following
Theodor @TP5_031
36 Followers 817 Following
~💕💕💕 @aimdaiily
116 Followers 1K Following
JCC @Jcortsac66
1 Followers 1K Following
heyhobbes @heyhobbes
192 Followers 3K Following Chronic shitposter. If you are taking investment advice from me, NGMI.

manpro sense Lab @Soloduo88
345 Followers 4K Following Journey for seeking Algo. "there is a Pattern,otherwise there must be a Pattern." R.I.P Jim..
Haaris Ahsan Safdari @HaarisAhsan
796 Followers 4K Following Staff Scientist EM @ MRC LMB, Cambridge, UK 📖 Single particle cryo-EM, cryo-ET
Maciej Bombol @Maciek6443
87 Followers 744 Following
Max Hawel @02max04
3 Followers 19 Following
Hamad @Aiibar786
22 Followers 92 Following
Normalized AI Cap @yz567
481 Followers 658 Following TMT L/S in software and semis. Notes and thoughts on the market, policy and tech. Tracks CN and US. Based in NY. DM is open.
Ferdinando Gelosa @FerdiGelo
256 Followers 2K Following


THE SHORT BEAR @TheShortBear
199K Followers 665 Following Market Wizards | Contrarian stoic trader and long term investor | since 2013 | Tweets are purely for entertainment purposes and not investment advice

Nir @NirAoo7
6K Followers 516 Following My posts/likes/retweet’s are NOT investment/financial advice. I'm a position/swing trader. Stop loss is non-negotiable. Opinions only, no advice. 📈🏀👨🍳
John F. Carter @johnfcarter
54K Followers 1K Following INC 500 Entrepreneur (#21 in 2014). Author, Mastering the Trade. Options trader. Unschooler. Member: EO, YPO. Wondering if reality is only a Rorschach ink-blot.
Christian Fromhertz �... @cfromhertz
93K Followers 2K Following CEO of The Tribeca Trade Group (TTG) Ex BAML Director ETF & D1 Trading. Momentum & Trend Trader. My MO: stay 1 step ahead of trends & momentum for TTG members

TML Trader @TMLTrader
92K Followers 96 Following Growth Stock Investor. Focused on finding & trading True Market Leaders. Lead PM https://t.co/xOknKiZTl0 TML Model Portfolio.
Lone Stock Trader @LoneStockTrader
87K Followers 18 Following 16Y full-time trader, US stocks - Focused on R-multiples and staying in tune with the market 🧠🧘🏻♂️ - Context & Environment are Everything.
jesse stine. Identify... @InsiderBuySS
31K Followers 2K Following Author- Insider Buy Super Stocks (2013). $46k to $6.8 million in 28 months (14,972%). My Bread and Butter ..... Complete transparency and TRUTH at any cost.
TSDR Trading @TSDR_Trading
52K Followers 2K Following TELL. SHOW. DO. REVIEW. Trader from MN. 4 young kids. Capturing market opportunities one chart at a time.
Brian Shannon, CMT @alphatrends
409K Followers 839 Following Trader, Author, Orophile, Technical Analysis Multiple Timeframes https://t.co/E4cQoecQva Only Price Pays® Maximum Trading Gains w/⚓VWAP https://t.co/4RBYa3EFPj
Ruth Capital @ruth_capital
52K Followers 388 Following Investment analyst based in the Baltics. This is my personal trading journal where I share my insights based on data analysis, and technicals! - DYOR/NFA
Rich Tougas @RicherTougas
259 Followers 365 Following
Charles Harris @chasharris1025
16K Followers 110 Following Portfolio Manager, O'Neil Global Advisors, Inc. No investment advice and views are my own.
Justin Saffel @Justin_Saffel
1K Followers 253 Following Engineer turned Financial Independence Coach | I help STEM professionals engineer their way to financial freedom | Join Financial Engineering School™ free 👇
Johns Charts @johnscharts
332K Followers 66 Following Options, Stocks and Theme Trader. Risk Management is #1. Not Investment Advice. ❤️Attack Survivor.
Ben @PatternProfits
6K Followers 259 Following $NQ $ES 📈📉 Trading Futures & Selling Premium. Much like playing poker, I bet when probabilities are favorable. Time Based Liquidity, ORB/IB, FVG, VWAP, 0DTE
Nathan Bancroft @n_bancroft2
18K Followers 236 Following Personal Trading Journal https://t.co/g01uVhkimV
TraderAmogh @TraderAmogh
102K Followers 257 Following Swing Trader • Chartist • Software Engineer. I share my trading strategies & journal trades via tweet threads All tweets are for educational purposes
Ed Ponsi CMT @edponsi
20K Followers 951 Following Trader, Educator, Author, CMT, Public Speaker, CNBC, Bloomberg, CNN, BNN, BBC, Fox Business

Stock Jaguar @stockjaguar2730
949 Followers 277 Following Swing/Position Trader. Frmr Env Engineer/ Prog Mgr. @UCLA Anderson MBA (2013) - @UCLABruins, #SF #49er Faithful #FTTB
avg joe trader @only4investing
551 Followers 743 Following EC focused Trader , experienced trader at https://t.co/vHFvg5yNFf and https://t.co/xCCA0n1loX
Mitchell Holloway @mitch_holloway
185 Followers 35 Following Ex-institutional trader | Swing → Position → Trend | 🇺🇸 🇭🇰 🇦🇺 Equities | Regenerative agriculture @hollowayfarmsnz | Ecclesiastes 1:9 ♻ | Journal ≠ advice
Christian Flanders @CFlanders7
18K Followers 690 Following Independent Trader. Aiming for SUPER PERFORMANCE in the stock market. USIC 2024 2nd Place +433%. USIC 2025 2nd place +167%. Avid tennis player.

Don Vandenbord @dvandenbord
7K Followers 3K Following Partner, CIO & Senior Portfolio Manager at Revere Asset Mgmt. Creator of the trend-following GROTECTION & ROBOTECTION investment strategies.
Oliver Wiedmaier @Ollie_AllCaps
5K Followers 118 Following Dad / Momentum Trader / USN Vet / MBA -Not financial Advice-
Matt Caruso, CFA, CMT @Trader_mcaruso
64K Followers 1K Following Record-breaking investor - US Investing Championship Top Performer - Former Market Maker and Professor - Unparalleled Membership https://t.co/DAWmY9DqTF
Wesley Mattox, CFA, C... @WesleyJMattox
8K Followers 460 Following Chief Technical Strategist and Portfolio Manager. Tweets are opinions and not investment advice.
stockbee @PradeepBonde
82K Followers 645 Following My profile is protected by Zulu Dick shrinking curse. To all scammers creating fake profiles, everyday your private part will keep shrinking. Look down.
Earnings Whispers @eWhispers
560K Followers 405 Following Providing key trading information around earnings releases.
Mansi @drmansipd
17K Followers 87 Following Trader in the US equity market. Beware imposter accounts. I NEVER send DMs. #PositiveVibesOnly 😇
Mike Webster @mwebster1971
49K Followers 333 Following Proud dad, trying to follow the golden rule. IBD-Senior Market Strategist. Prior = O'Neil Capital Mgmt-SVP/PM, PM for a private fund. Ideas ≠ advice
StockChartArt @CasualtyWar
41K Followers 2K Following Chart wizard | trend trader | $BTC enthusiast | 👀 for the next monster stocks |
Michael Walstedt, CFA @MichaelWalstedt
8K Followers 99 Following Founder & Lead Advisor at Reliant Wealth Advisory. Tweets are not advice. Learn more ↓

Traderstewie @traderstewie
462K Followers 543 Following Making confident traders since 2009! Join the 'Art Of Trading' community today! https://t.co/Dp8OvaAgdi Blog: https://t.co/sCi8fDzBJB
Eve Boboch @EBoboch
11K Followers 3K Following Portfolio Manager and Market Strategist, Co-Author of The Lifecycle Trade. https://t.co/Lq227h4v7v
Brandon @amphtrading
9K Followers 247 Following Full Time Trader | “Trusted Pine Programmer” endorsed by TradingView | MarketLens
AsymTrading @AsymTrading
34K Followers 41 Following 20+ year student of the mkt. Swing trading breakouts from higher lows and tightening ranges on the highest ADR, highest momentum stocks. KK/KQ is the GOAT.
Chris Perruna @cperruna
178K Followers 712 Following Owner's Rep, investor & weather enthusiast. Husband, dad, dogs & sports. My only account has a blue checkmark. Beware of impersonators. No investment advice!
Kristjan Kullamägi �... @Qullamaggie
173K Followers 72 Following Traded $3K into $100M. Featured in the upcoming Market Wizards book. Live streamed my journey https://t.co/JsLb4klZoM Nowadays mostly lurking.
Marty Chargin @MartyChargin
51K Followers 2K Following I have seen the stock market change people's lives! It can change yours too. Never Give Up! You may find my best stock ideas at: https://t.co/rqfRosoA4A
Rain King @JPoco722
15K Followers 102 Following Growth Stock Trader, 25yrs. Founder BlueSky Event LIVE Elevate Conference 2025 YouTube Channel: @RainKingLLC
Jonathan Whitcraft @jaywhitcraft
13K Followers 4K Following Hybrid Position/Swing Trader, Cancer Survivor, Father, Brother, Uncle, Wine lover and Windsurfer. All opinions are my own and not investment advice.
Mark Minervini @markminervini
697K Followers 160 Following Author Trade Like A Stock Market Wizard and Think & Trade Like a Champion. Featured in Stock Market Wizard by Jack Schwager. Before following read disclosure.
James Roppel @Upticken
52K Followers 684 Following Hedge Fund Manager - Roppel Capital Management - Equity & Crypto Optimist #FreeMarketAdvocate #GoldenGooseOfCapitalism
Sunil Gupta @Trade_4_Freedom
2K Followers 17 Following HH-HL mkt structure trader, w/ full time job. Price, vol & few MAs only. Opinions≠Advice 🇺🇸🇨🇦🇮🇳
Gil Morales - TheOWLT... @gilmoreport
33K Followers 0 Following Gil Morales is a former Chief Market Strategist for Bill O'Neil & co-author of "Trade Like an O'Neil Disciple: How We Made 18,000% in the Stock Market."Trends for United States
You might like